The core capabilities provided by Superset are :
-
Interactive data exploration.
-
Interactive chart design and generation.
-
Dashboard design and creation.
-
Graphical SQL query development.
-
Interactive SQL development environment.
To use the Superset app while using Spaces, users must:
-
Activate a Space session.
-
Wait for the tools to load.
-
Select the Superset tool icon.
Users may also use an ‘on-platform’ version of Superset, guidance for which can be found on the more comprehensive ‘Using Superset in a Space’ page.
Data
In Spaces, Superset charts and visualizations are built from connections to hosted data sets. As part of the Space configuration, a Superset ‘Data Source’ called Spaces Metastore is created that provides the connection to the data products.
Additionally a Superset ‘Dataset’ is created for every table within the data product data bases. These data sets describe each table associated with the Space, including the field names and data types. These actions are taken as part of Space configuration so that the datasets are fully available at the start of a Space session without any manual configuration.
The Superset dataset definitions are refreshed during each Space activation so that any updates to the data products associated with a Spaces will be reflected.
Whilst Data Product tables are automatically configured during Space activation, custom tables and outputs created in collaborate_db and publish_db are added by users.
To add a table in collaborate_db or publish_db to Superset, users must:
→ Data
→ Datasets
→ “+ Dataset”
→ Select Data Source
→ Select collaborate_db or publish_db from the Schema drop down
→ Select the table you wish to add from the Tables drop down
→ Click Add
This will add the table that been created in one of these data bases as a Superset dataset, including inferring all the column names and data types.
Further guidance on exploring data in Superset is found here.
Charts
This component allows you to explore data and create charts and visualizations from the Superset Datasets. Charts are visually configured by selecting elements such as :
-
Chart type.
-
Fields of interest.
-
Required metrics (e.g. count, sum, min, max, custom calculations etc.)
-
Visual configurations (colour schemes, labelling, titles etc.)
To create a chart in Superset do, users must:
→ Charts
→ ‘+ CHART'
→ Choose a Dataset from the top left hand side drop down
→ Select a chart type via either the categories or by searching for chart types
→ Select ‘CREATE NEW CHART’
Full guidance on charts available, and configuration options for each type can be found through the open source Superset documentation described in https://superset.apache.org/docs/intro
Once finalized, charts can be saved for use in future sessions and Dashboards.
As all superset visualizations are based off of SQL logic that is executed against the data sources, charts can also be used as a visual SQL code development tool. Once a chart has been created showing the metrics and insights required, the underlying SQL logic can be accessed by clicking the three bars button in the top right hand control bar and selecting ‘View query’ or ‘Run in SQL Lab'“
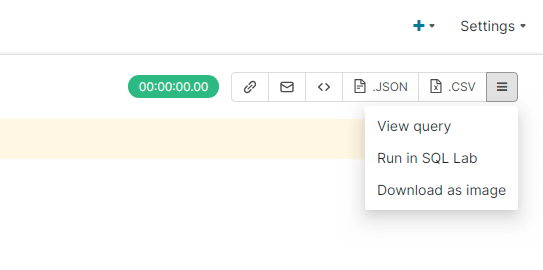
This displays the underlying logic which can be executed within the Spaces SQL tools to create outputs in collaborate_db or publish_db, and used to facilitate Automated Tasks to create the output metrics on an on-going basis.
A useful demo of how to create more complex charts on Superset is found here.
Dashboards
This component allows you to create dashboards by combining the charts you have produced into reporting views and insight analyses. In addition to your charts other formatting objects such as tabs, rows, columns and markdown text boxes can be included in dashboards to provide richer insights and context to visualizations.
To create a dashboard in Superset do:
→ Dashboards
→ ‘+ DASHBOARD’
→ Update dashboard name in top left of pane
→ ‘SAVE’
Once you have saved your dashboard you can start to add structuring elements and data visualizations by dragging and dropping the components required from the right hand ‘COMPONENTS’ and ‘CHARTS’ panes within the design view.
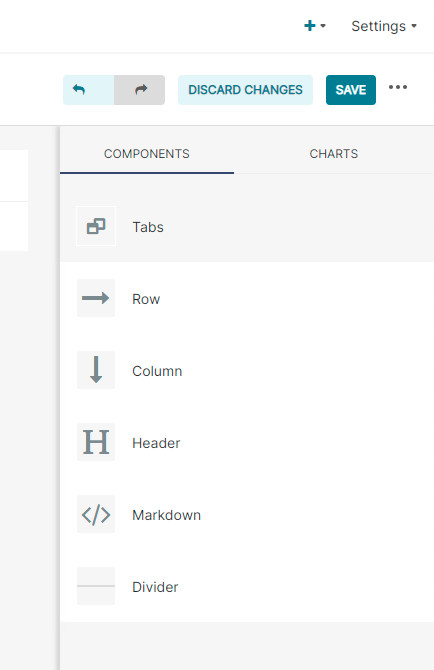
Use the ‘SAVE’ button to save progress as dashboards are incrementally developed. When saved Dashboards are available to all collaborators within a Space.
Further guidance on creating dashboards in Superset is located here.