Superset is a powerful tool used for data visualization, SQL development, and dashboard creation. Users can access Superset on the Harbr platform in two ways:
-
Via Spaces – Superset is available as a tool within Spaces to support collaboration on specific project, product, or collaboration where the data context is predefined and shared.
-
Via My Collection – A standalone, on-platform version of Superset that provides similar functionality outside of Spaces. This Superset instance is not tied to a specific workspace, meaning users can create charts with data they have access to across the platform.
Across both access paths, Superset provides the following core capabilities:
-
Interactive data exploration
-
Interactive chart design and generation
-
Dashboard design and creation
-
Graphical SQL query development
-
Interactive SQL development environment
This guide explains how to use Superset both via Spaces and on-platform, and introduces tips and advanced features for getting the most out of the tool.
Accessing Superset
In Spaces
To use Superset in a Space:
-
Activate the Space session.
-
Wait for the tools to fully load.
-
Select the Superset icon from the tool ribbon.
This launches Superset with automatically configured data connections to any data products and assets permissioned within that Space.
On-Platform Superset
To use the standalone Superset tool:
-
Navigate to My Collection.
-
Click the Superset button in the top-right corner of the page.
Superset is made up of three main components:
-
Data – Where datasets are configured and managed.
-
Charts – Where visualizations are created based on datasets.
-
Dashboards – Where charts are combined into full reports or interactive analysis views.
How it Works
Data
In Spaces, Superset charts and visualizations are built from connections to hosted datasets. When a Space is configured:
-
A Superset Data Source called
Spaces Metastoreis created. This provides a live connection to the Space’s data products. -
A Superset Dataset is automatically created for each table in the associated data products. These datasets include metadata such as field names and data types.
These actions happen automatically during Space configuration to ensure the datasets are fully available at the start of a session, meaning no manual setup is required for the product tables.
Every time the Space is activated, these Superset dataset definitions are refreshed, meaning:
-
Any updates to the structure or contents of the data products are reflected.
-
Users always see the most up-to-date schema.
Adding Tables from collaborate_db or publish_db
While data product tables are automatically added, custom tables and outputs created within collaborate_db or publish_db are added manually.
-
Navigate to Data > Datasets.
-
Click + Dataset.
-
Ensure the Spaces Metastore is selected (this is the default).
-
From the Schema dropdown, select either
collaborate_dborpublish_db. -
From the Tables dropdown, select the relevant table.
-
Click Add.
Superset will automatically infer and populate column names and data types from the selected table.
For the platform Superset tool, given there is no automated dataset setup, users will need to create Datasets manually..
-
Go to Data → Datasets → + Dataset
-
Select a data source to which you have access (ie. a subscribed Product)
-
Choose a schema and a table
-
Click Add
Further guidance on how to explore data in Superset is found here.
Charts
The Charts component of Superset allows you to explore datasets and create visualizations. Charts are configured by selecting elements such as:
-
Chart type (bar, line, pie, time series, etc.)
-
Fields of interest
-
Required metrics (e.g. count, sum, min, max, or custom calculations)
-
Visual display options (e.g. colour scheme, labels, axis names, titles)
To create a chart:
-
Go to Charts.
-
Click + CHART.
-
Choose a dataset from the dropdown in the top left.
-
Select a chart type using the categories or by searching.
-
Click Create New Chart.
-
Configure the chart using the available Data, Customization, and Advanced Analytics panels.
Once finalized, charts can be saved and reused in Dashboards or other Space sessions.
To extract the SQL behind a chart:
-
Click the three-bar menu in the top-right corner of the chart.
-
Select View query or Run in SQL Lab.
This opens the full SQL logic behind the chart, which can then be modified, reused in SQL Lab, or saved as a Code Asset. These outputs can be automated using the platform’s Tasks functionality.
A useful demo of how to create more complex charts on Superset is found here.
Dashboards
Dashboards allow users to combine charts into structured reporting views. In addition to charts, dashboards can include layout and formatting elements, such as:
-
Tabs
-
Rows and columns
-
Markdown components
-
Headings and spacers
To create a dashboard:
-
Go to Dashboards.
-
Click + DASHBOARD.
-
Rename the dashboard in the top-left field.
-
Click SAVE to create it.
Once created, you can add charts and other elements by dragging and dropping them from the Charts and Components panes on the right-hand side of the design view. Use SAVE regularly to save your progress. Dashboards are collaborative, meaning once saved, they are available to all users within the Space.
Further guidance on creating dashboards is located here.
SQL Lab
SQL Lab is a graphical SQL development environment. It enables:
-
Querying of Data Products
-
Exploration and validation of results
-
Visual chart creation based on SQL outputs
-
Development of SQL-based Code Assets
In addition to standalone querying, SQL Lab integrates tightly with Superset’s chart and dashboard tools, making it a critical part of the end-to-end analysis workflow.
All Code Assets created on the Harbr platform originate from SQL Lab.
Further guidance can be found in ‘Using SQL in a Space’ page and the Microsoft SQL Docs.
Superset Tips and Tricks
The following guide contains advanced tips and techniques that go beyond the basics. These are especially useful when creating dashboards or answering more complex analytical questions.
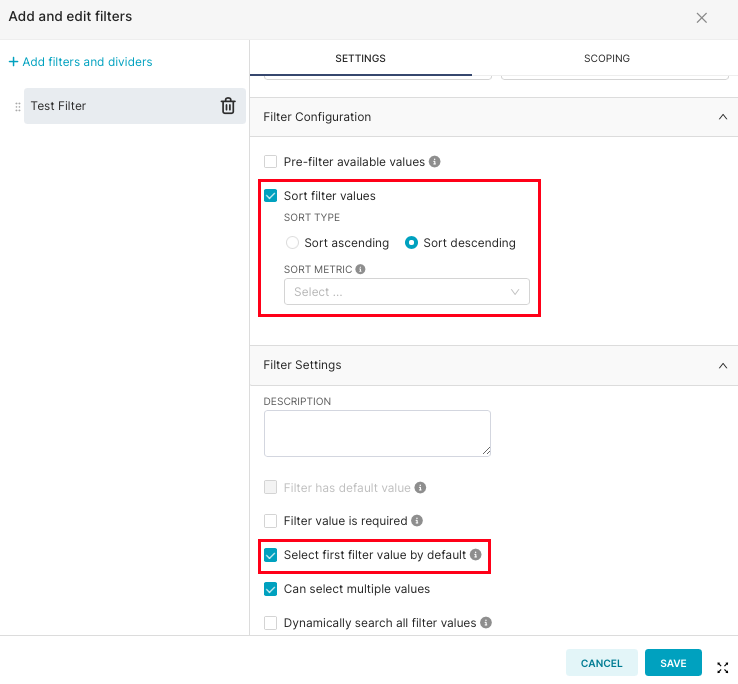
Dynamic Filtering
To pre-filter a dashboard to the most recent year or date available in the dataset:
-
Add a filter control (e.g.
Year). -
In the filter settings, sort values in descending order.
-
Enable "Select first filter value by default".
This will cause the dashboard to automatically load using the most recent year available in the data.
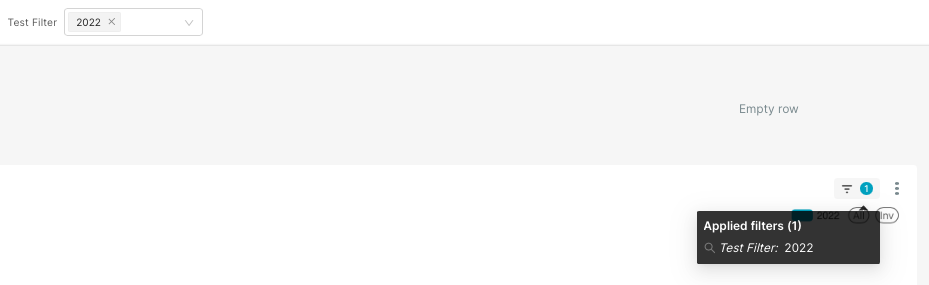
Display Filter Context on Charts
To help viewers understand which filters are being applied:
-
Look for the three-bar icon in the top-right of each chart visualization.
-
Click it to see a list of active filters for that chart.
-
This modal expands automatically as more filters or cross-filters are added.
This ensures that readers always understand the data context behind what they're seeing.
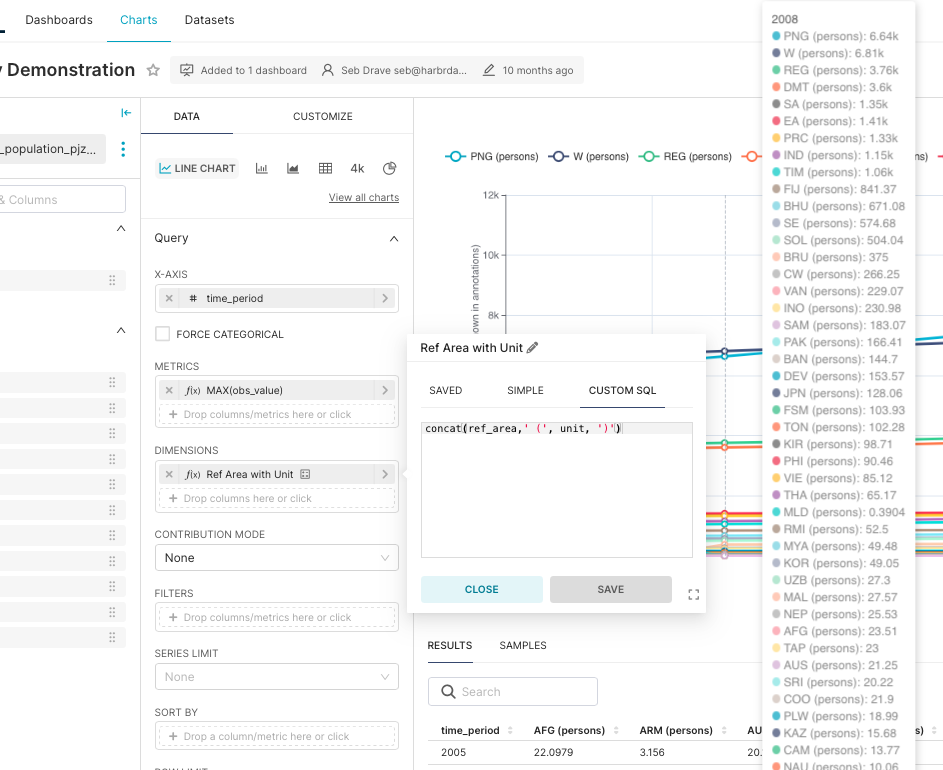
Interactive Tooltips
You can enrich chart tooltips with helpful reference values like country names, units, or metrics.
Option A: Custom SQL Fields
Within the chart configuration, use the Custom SQL field to combine multiple dataset fields into a single string. For example:
"Country" || ' - ' || "Unit"
This will render a combined value in the tooltip when hovering over a chart element.
Option B: JavaScript for Geo Charts
Some Superset map-based visualizations support JavaScript-based tooltips, allowing even greater flexibility in what is displayed (e.g. showing population + region + change rate on hover).
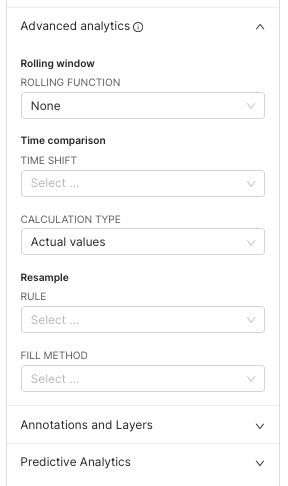
Trend Analysis
Many chart types offer advanced capabilities that allow you to:
-
Add regression lines
-
Overlay moving averages
-
Compare against previous periods
These settings are found at the bottom of the Data panel when configuring a chart. This is especially useful for time-series analysis or identifying shifts over time.
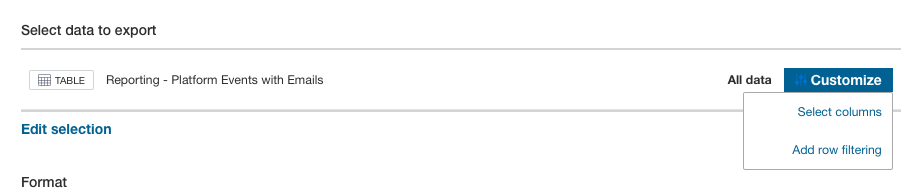
Flexible Data Export Options
By default, Superset allows you to download the data displayed in a chart, but not the full dataset that is loaded into the chart.
To enable more flexible export (e.g. full datasets or selected columns):
-
Create a Data Asset that includes the full dataset used in your visuals.
-
Add that Data Asset to a Product, and give users access.
-
In your Superset Dashboard, use Markdown text boxes to provide links or instructions like:
-
“To download all rows, go to the Export tab of this product.”
-
“To build your own query, use the Query tab.”
-
Export now supports row and column-level filters, so users can customize the data they retrieve.
Visualization Assets
To ensure users' seamless access and viewing of Superset dashboards on both when embedded on a Product page and when used to create a Visualization asset, the dashboard URL must be constructed in a specific format. Before the /superset/dashboard/... path, you must prepend the following login and redirect segment:
/login/?next=
This enables the Harbr Platform to:
-
authenticate the user into the Visualization service,
-
establish the required authentication cookie, and
-
redirect the user to the intended Superset dashboard.
This allows users to be directed to the intended dashboard immediately, without needing to log into Superset prior to viewing.
Example
Original dashboard URL:
https://visualisations.harbr.group/superset/dashboard/34/?
Required dashboard URL format:
https://visualisations.mcdata.ecosystem.harbr.group/login/?next=/superset/dashboard/34/?
When updating dashboards that are linked in Product Pages and Visualization assets, after saving the changes in Superset, users must create a new asset or embedded link with the updated URL and swapping the previous out in the Product.
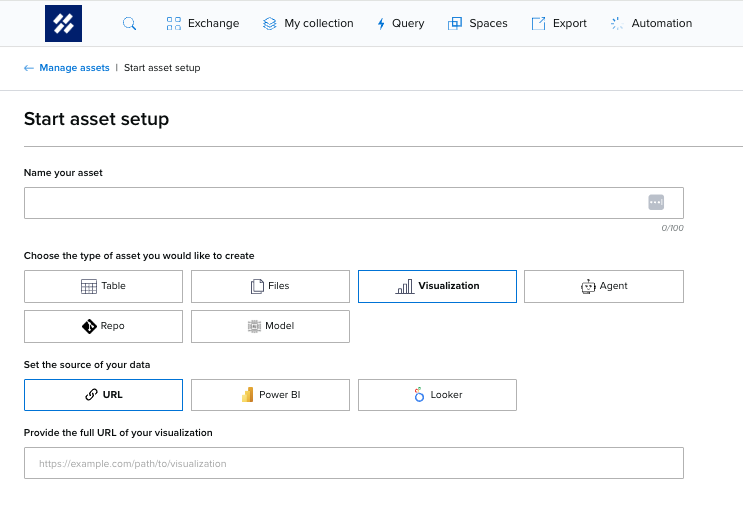
Creating a Visualization Asset
To create a Visualization asset using Superset:
-
Select Visualization as the asset type.
-
Set ‘URL’ as the source of the data
-
Input the dashboard URL, as laid out above.
-
Complete the remaining steps to configure and release the asset.
Once released, the asset can be:
-
Shared directly with other users
-
Added to a data product
Note: Users only need the Access entitlement to view a Visualization asset or a data product containing one.
Once a user has Access:
-
Navigate to My Collection or the relevant data product in the Exchange.
-
Select the asset to open